Weather station - Data visualization
Table of Contents
Weather station - This article is part of a series.
In today’s standards, no project, which includes a data acquisition component, is complete without any proper data visualization, as “raw” data alone can look like a bunch of random numbers and letters clumped together. There is a variety of technologies and tools to achieve the desired visualization, but I decided to make this a challenge and use Rust to make an OS-agnostic (Windows and Ubuntu) desktop application.
Prerequisites #
Rust has a lot of powerful low-level tools in its toolbox, with a wide selection of GUI frameworks and interesting (sometimes frustrating) programming concepts and techniques (looking at you, ownership) which allows developers to create more stable and safer applications and this is what sets Rust apart from languages like C++ or Golang.
One interesting fact - Linux developers are moving the Linux kernel technology from C to Rust. So, it seems that Rust has really great potential to be a main technology on future projects for developers coming from a low-level technology.
But I digress.
For this project, I used the Druid GUI framework to create the application with the plotters-druid “addon” which allows me to create that juicy visualization.
If you installed Rust for Windows as
suggested, the application should run out-of-the-box by just running a simple cargo command, but Ubuntu needs some special attention by installing additional
GTK libraries to make this work properly. The installation steps can be found in the project
README file.
How does it work? #
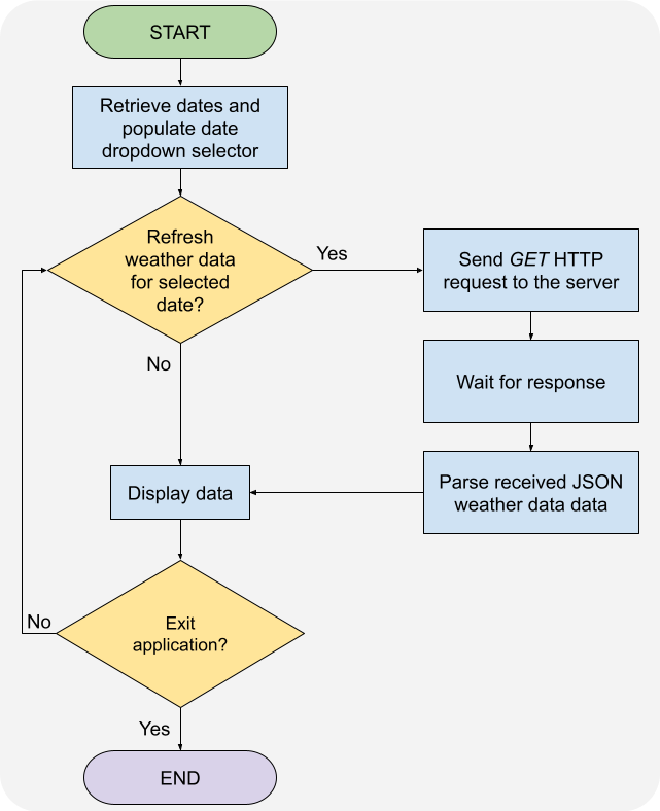
The application workflow is rather simple, as it can be seen from the picture below.

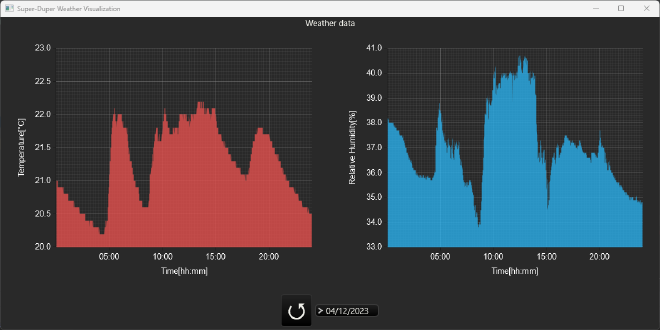
Basically, when the refresh event occurs, asynchronously fetch the weather data, parse the response and visualize it in the application. Preview of the desktop application with 24 hours temperature and humidity data can be seen in the following picture.

In order to visualize new data from the server, the user needs to select a date and hit the ⭯ (refresh) button which will then execute the previously described workflow.
You probably noticed that I did not include any error handling functionalities (i.e, server not reachable, error while encoding data, etc.) in the workflow, and it’s because I want to have a minimal working application at this stage and verify that the application is following the proposed workflow, but I will consider to add error handling later on as it’s a necessary aspect for a robust application.
In the end, to run the application, just execute the following command where the main cargo.toml file is located (in this case, root of the application folder)
cargo run .
Server improvements #
As mentioned in a previous blog post, the server API will be extended so the server has all needed functionalities to fetch data for specific dates. Therefor, I added three additional routes with unique handlers, which are:
/get/{date:^[0-9]{8}$}- Fetch the weather data from the specified date/dates- Fetch all unique dates on which the measurement was taken/dates/latest- Fetch the latest (newest) date
GetByDate handler>GetByDate handler
#
Let’s have a better look at the getter function which fetches specific date weather data, called GetByDate, as there are quite some things going on under the hood. Firstly, one example of a request to fetch the specific date weather data looks like the following:
http://192.168.1.1:3500/get/20230412
The request URL consists of the server address and port on which it’s listening to, followed by the endpoint route in which the last section of the URL is the date query parameter in the format YYYYMMDD. The reason why I chose this format is because MongoDB stores it’s datetime information in a similar fashion so it would be more intuitive to read the given “raw” database data if any reasons occur and to be more consistent with the rest of the system.
Chi (the web framework) allows us to use regular expression, which will be used while sending query requests to the server and define what kind of data will be accepted from the server. The regular expression ^[0-9]{8}$ will only process data that consists entirely of 8 digits (0-9), from the beginning (^) to the end ($) of the string, otherwise it will return a 404 error code as response.
When the GetByDate handler is called, the passed date is converted into a
Time data type which allows to do various datetime operations like conversions from one date format to another. Golang also has a great support for MongoDB so fetching data is relatively straightforward. Afterwards, a date filter is created based on the converted date which will then return all weather data which satisfy the given conditions in the filter. In this case, return all data from the first (00:00:00h) until the last (23:59:59h) measurement for the given day.
For completeness, the following code snippet shows the filter described above.
dateFilter := bson.D{{"created_on", bson.D{
    {"$gt", primitive.NewDateTimeFromTime(parsedDate).Time().AddDate(0, 0, 0)},
    {"$lt", primitive.NewDateTimeFromTime(parsedDate).Time().AddDate(0, 0, 1)},
}}}
The bson.D represents a data type in which order of the
BSON elements matter, which, in this case, are important as the data should be sorted from oldest to newest. More about the MongoDB data structs can be found
here.
$gt (greater than) and $lt (less than) represent the conditions which must be met in order to retrieve all data for the given date. Someone probably asks “Why not use some kind of equal criteria?” - I tried, but the $eq (equal) operator would return only a single entry.
After that, the query command is issued with the above given filter criteria, which returns a
cursor to the found stream of documents which met the conditions over which we iterate, store each element into a query result buffer (
slice] of the WeatherData struct), and respond back to the caller with the data.
Conclusion #
This part of the project was quite of a challenge, mostly because I used new and unfamiliar technologies and frameworks, but it was a lot of fun. Rust and Golang can create great software solutions for any situation and any project, but, in some cases, it’s lacking support as those languages are relatively new compared to C++ so you have to use workarounds to get things work as intended.
Another thing that I would like to add to this project is a web-based application created with Wasm so we can use it on any platform (mobile or PC), but this is for another time as this has challenges on it’s own.
Hope you enjoyed it and thanks for reading!